S&P 500 Is Enough in Bull Markets. AI Screening Only Shines During Crashes
The Bottom Line
I built an AI stock screening system and ran backtests on 730,000 data points over 5 years.
What I found: in bull markets, picking individual stocks barely beats the S&P 500.
But during crashes, stock selection makes an overwhelming difference.
The Big Picture: 4 Strategies Compared
I screened all S&P 500 stocks using 4 investment strategies. Here are the results.
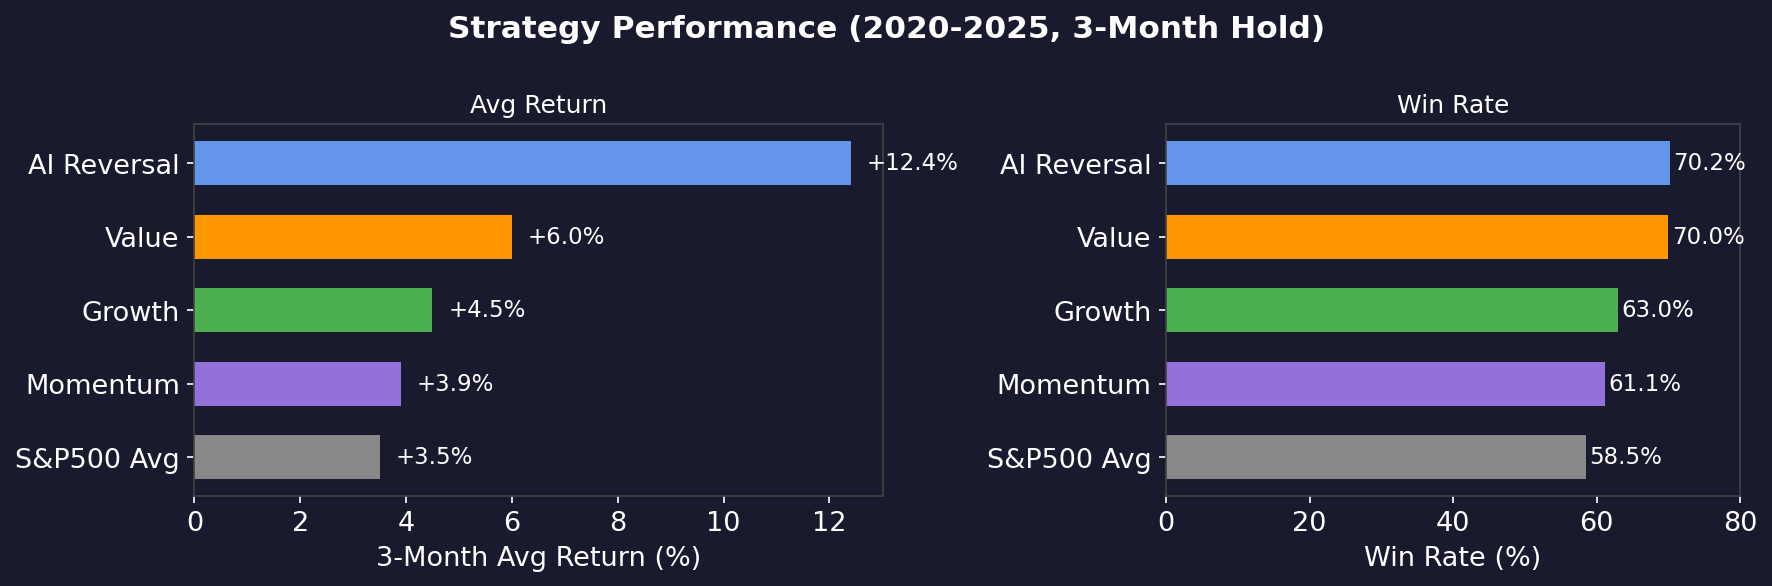
Only the AI Reversal strategy stands out. Average 3-month return of +12.4%, win rate 70.2%.
The other 3 strategies (Value, Growth, Momentum) are barely different from the S&P 500 average.
But why does only Reversal work? The answer lies in market conditions.
The Harsh Reality of Bull Markets
When we split returns by market regime, the results are striking.
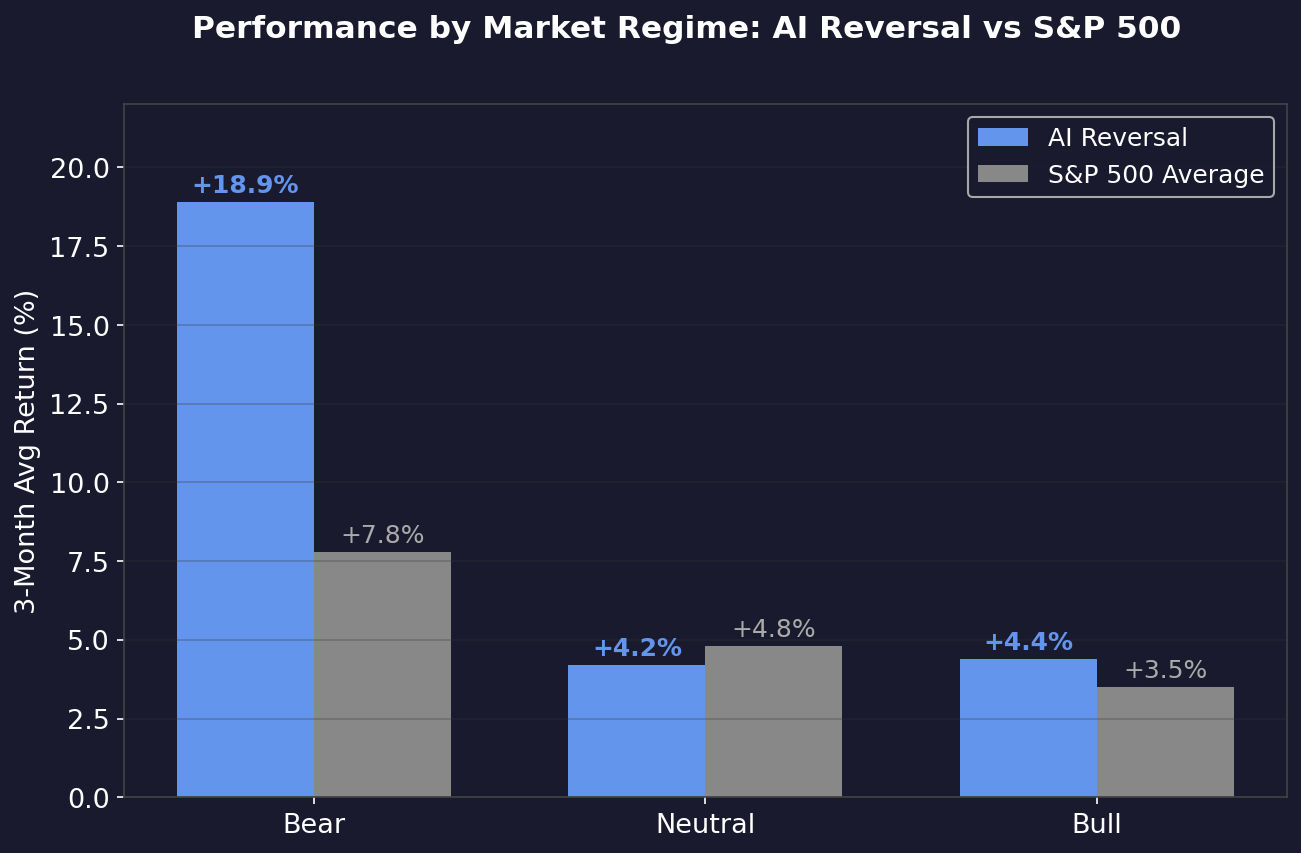
In bull markets, AI Reversal and the S&P 500 average are nearly identical (+4.4% vs +3.5%).
When the whole market is rising, there's little point in picking individual stocks. Just buy VOO or SPY and sleep — that's what the data says.
But in bear markets, Reversal returns +18.9%. That's 2.4x the S&P 500 average. This is where the massive gap appears.
Why AI Works During Crashes
Mechanism 1: Oversold Stocks Snap Back Like a Spring
In statistics, there's a phenomenon called "mean reversion" — extreme values tend to return to the center.
Here's what happens when we test this in the stock market.
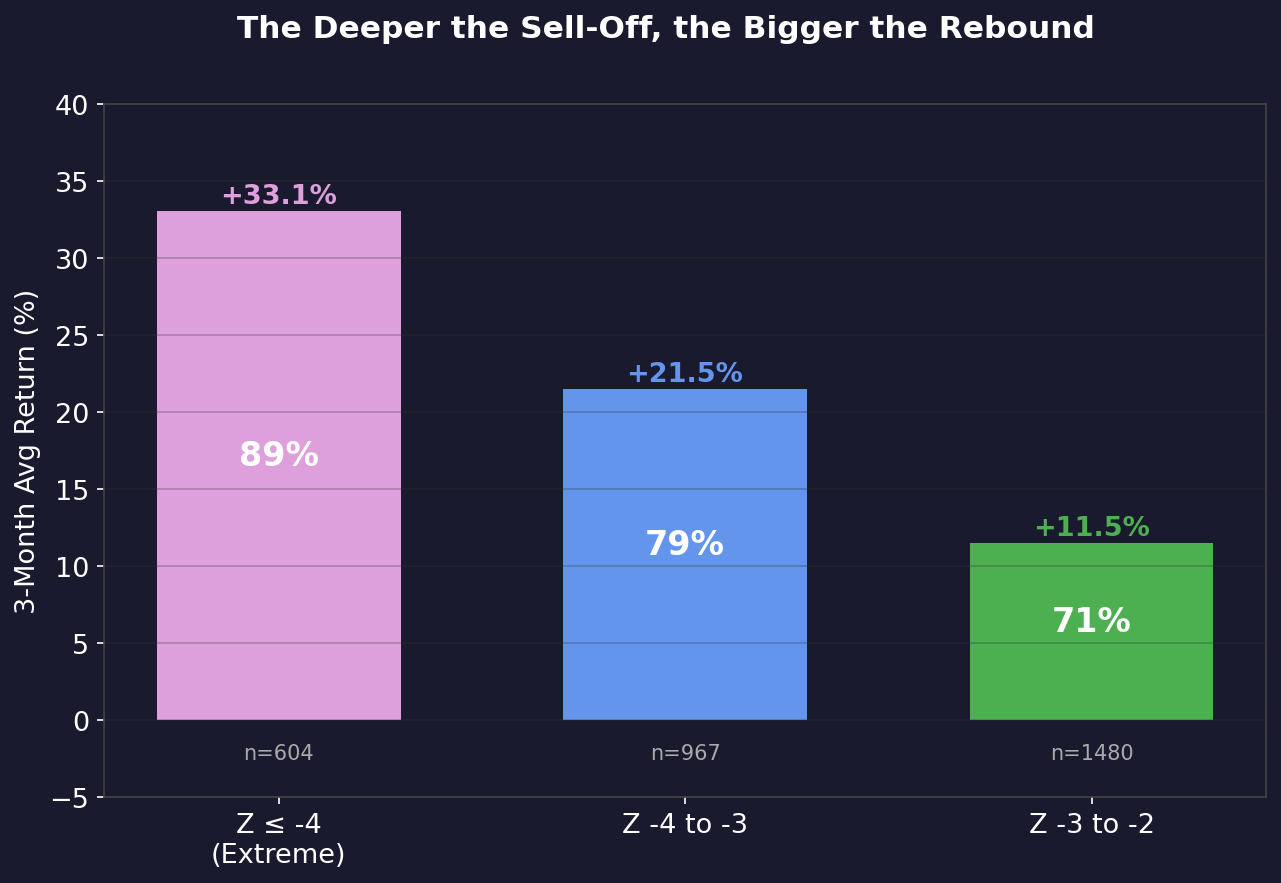
The Z-score measures how far a stock's price has deviated from its 126-day (half-year) average, in standard deviations. Z = -2 means "the stock is 2 standard deviations below its average." Statistically, Z ≤ -2 occurs only ~2.3% of the time — a rare, abnormal low.
The deeper the "abnormally cheap" level, the larger the rebound:
- Z ≤ -4 (4σ below average, probability 0.003%): +33.1% in 3 months, 89% win rate
- Z -4 to -3 (3-4σ below): +21.5%, 79% win rate
- Z -3 to -2 (2-3σ below): +11.5%, 71% win rate
Z ≤ -4 is a "statistically near-impossible low" — and when stocks fall that far, they rebound within 3 months 89% of the time.
Mechanism 2: It Drops First, But Wait and You Win
Even knowing "buy during crashes" is the right move, executing it is hard. Because right after you buy, it keeps falling.
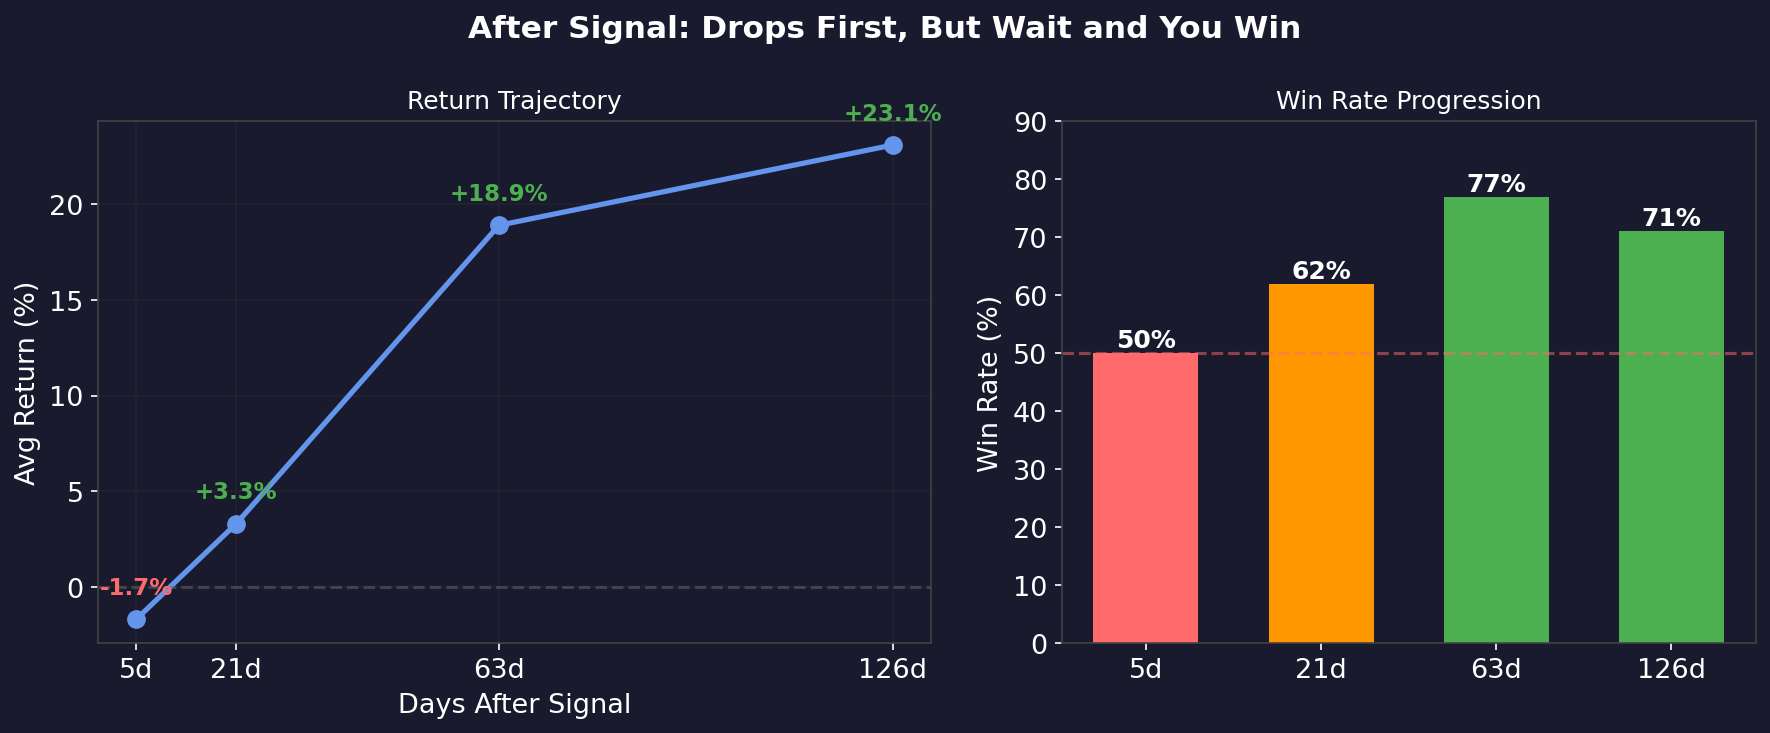
Looking at the trajectory after signal:
- 5 days later: -1.7% (still falling. Win rate 50% = coin flip)
- 21 days later: +3.3% (slight recovery. Win rate 62%)
- 63 days later: +18.9% (real rebound. Win rate 77%)
- 126 days later: +23.1% (stable. Win rate 71%)
Signals fire during panic selling, so they don't pinpoint the exact bottom. But wait 3 months and you're up +19%.
This is a judgment call that's nearly impossible for humans. Almost no one can calmly decide "now is the time to buy" in the middle of a crash. But AI has no emotions — if conditions are met, it generates the signal.
Mechanism 3: They're Not Sold Because They're Bad
I examined the fundamentals of stocks that triggered signals.
| Signal Stocks | Others | |
|---|---|---|
| ROIC | 10.5% | 16.0% |
| F-Score (Financial Health) | 5.0 | 5.6 |
| Beta (Market Sensitivity) | 1.07 | 0.97 |
| Volatility | 63% | 46% |
ROIC and F-Score are slightly lower, but not catastrophically bad.
The decisive difference is higher beta and volatility. These stocks are "excessively" sold along with the overall market decline. If fundamentals aren't broken, they recover once the fear subsides.
The S&P 500 falls equally, but doesn't recover equally. Higher-beta stocks sink deeper and bounce harder. This system automatically detects those "oversold quality stocks."
Mechanism 4: Tech, Consumer, and Energy Rebound Explosively
Let's look at returns by sector.
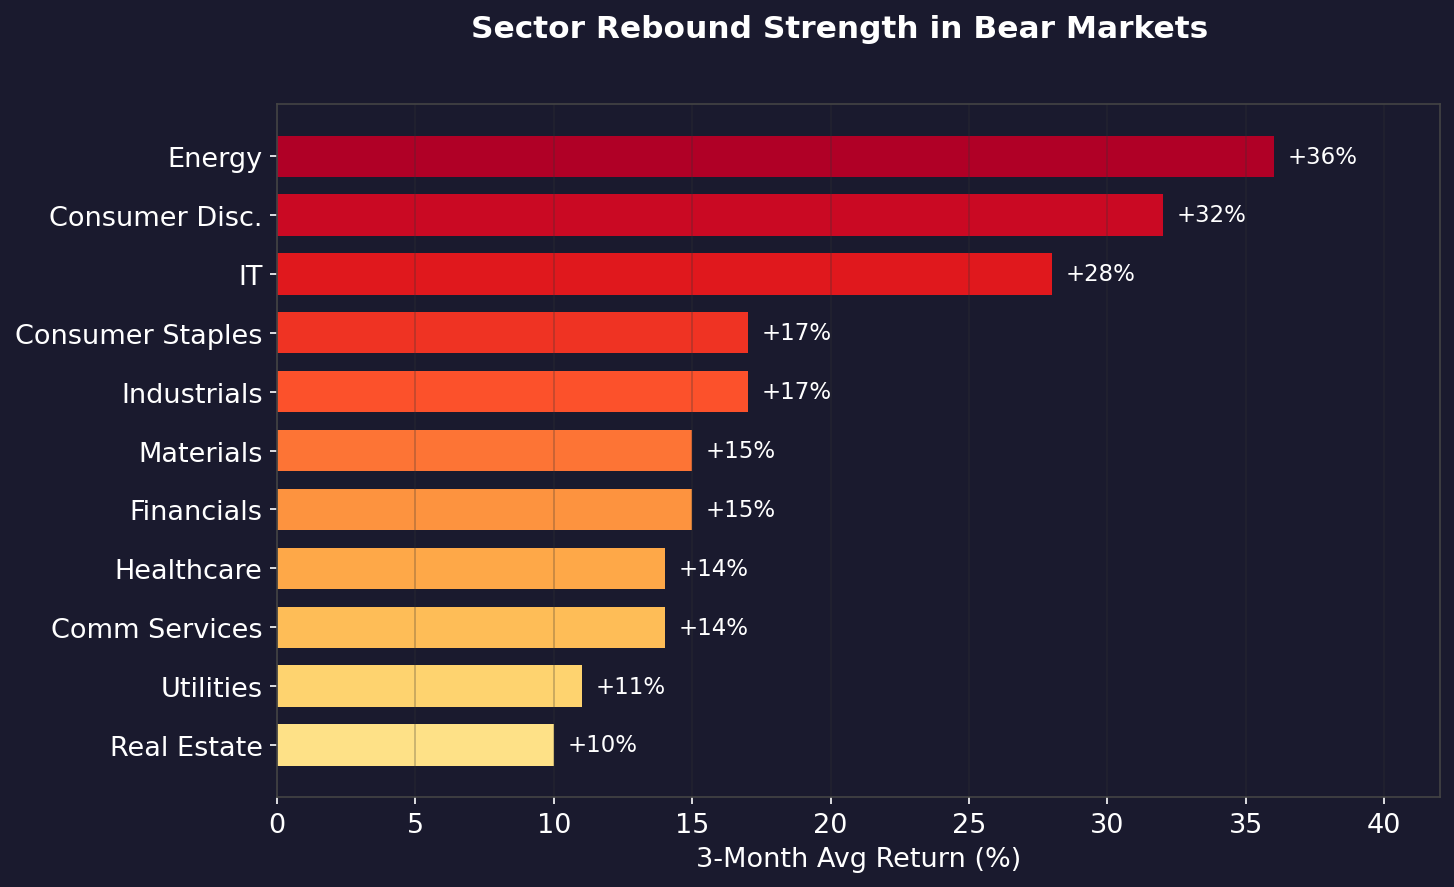
Cyclical sectors (Energy +36%, Consumer Discretionary +32%, IT +28%) get sold the hardest during crashes and rebound the most. This is consistent with higher beta.
So What Should You Do Normally?
The investment strategy derived from this data is simple.
During Bull Markets
- Hold the S&P 500 index (VOO/SPY)
- Keep AI screening in "watch mode"
- Don't chase individual stocks
When Bear Market Hits
- Switch AI screening to "attack mode"
- Focus on stocks with reversal signals
- Shift part of your portfolio to individual stocks
Where Are We Now?
The system also auto-detects market regime (Bull/Neutral/Bear).
- SPY > 200-day MA + 2% and VIX < 20 → Bull
- SPY < 200-day MA - 2% or VIX > 30 → Bear
- Otherwise → Neutral
As of March 22, the regime is Neutral. It was Bull until mid-March, but SPY broke below MA200 and dropped to Neutral. It's only 0.21% away from Bear conditions (MA200 - 2%).
| Date | Regime | SPY MA200 Deviation | VIX |
|---|---|---|---|
| 3/15 | Bull | +0.56% | 27.2 |
| 3/17 | Bull | +1.52% | 22.5 |
| 3/20 | Neutral | -0.05% | 24.8 |
| 3/22 | Neutral | -1.79% | 26.8 |
"Bull = leave it alone" and "Bear = let AI take over." Just being able to make this switch dramatically improves performance. And right now, we're approaching exactly that transition point.
Bonus: Value Strategy Has "Positive Every Year" Consistency
Reversal has explosive power during crashes, but signals don't fire all the time (signal frequency 0.76%).
Meanwhile, the Value strategy (ROIC > 15% + Piotroski F-Score ≥ 7) consistently beats the S&P 500 every year.
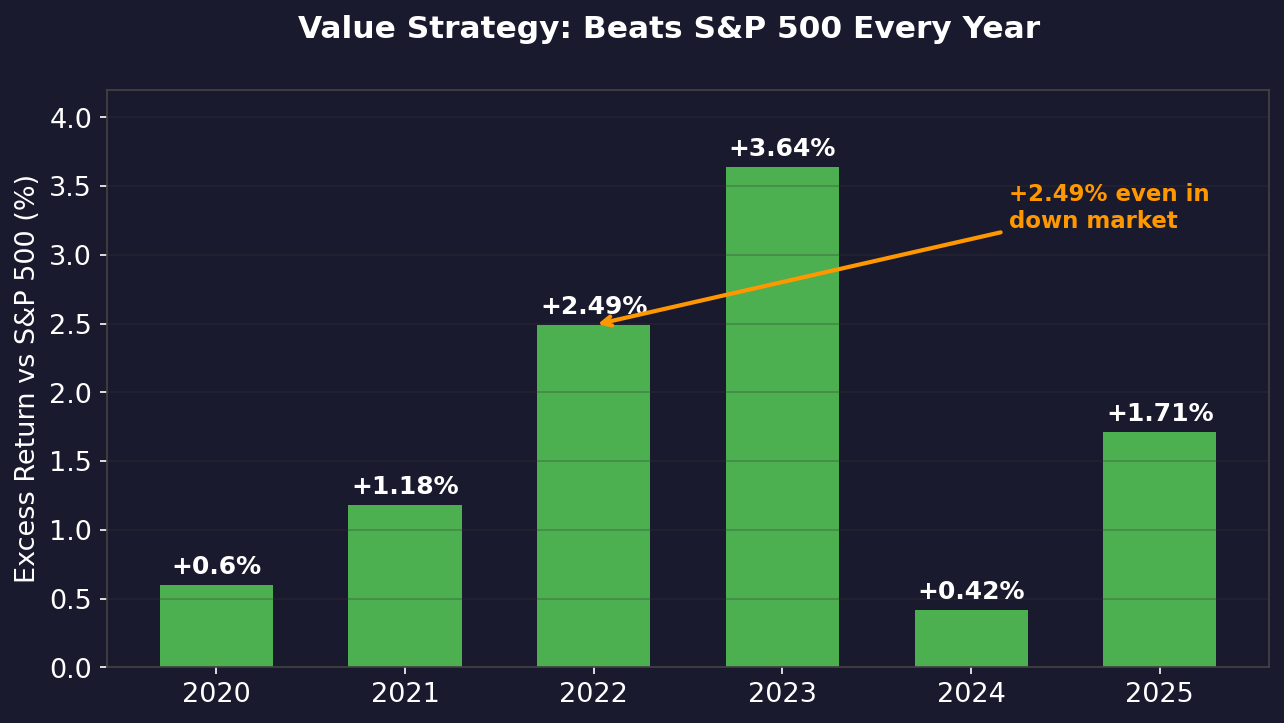
Even during the 2022 downturn, it secured +2.49% excess return. 6 years, never lost to the S&P 500.
"Reversal during crashes, Value during normal times" — that's the optimal combination this system suggests.
Summary So Far
- S&P 500 index is sufficient in bull markets
- Reversal strategy shines during crashes (3-month +19%, 77% win rate)
- Rebound strength varies greatly by sector (Energy +36%, Consumer +32%, IT +28%)
- The deeper the sell-off, the bigger the rebound (Z ≤ -4 = 89% win rate)
- As of March 22, regime is Neutral — on the edge of Bear transition
From here, we'll examine "which specific stocks to target" across all S&P 500 stocks. Data spans up to 63 years (from 1963). We'll separate "stocks that truly rebound" from "trap stocks" by sector.